

[Apr-2024] APICS CPIM-8.0 Exam Practice Test Questions - PrepAwayTest
Updated Certification Exam CPIM-8.0 Dumps - Practice Test Questions
NEW QUESTION # 89
A house of quality (HOQ) chart aligns which pair of functions?
- A. Competitive analysis with product design
- B. Engineering with operations
- C. Customer purchasing with supplier shipping
- D. Customer requirements with costing
Answer: A
Explanation:
A house of quality (HOQ) chart is a product planning matrix that is used to show how customer requirements relate directly to the ways and methods companies can use to achieve those requirements. HOQ charts are part of the quality function deployment (QFD) method, which helps to ensure quality in product development and service delivery. HOQ charts use a design that resembles the outline of a house, with different sections representing different aspects of the product or service1. One of the functions that a HOQ chart aligns is competitive analysis with product design. Competitive analysis is the process of evaluating the strengths and weaknesses of the competitors in the market, and identifying the opportunities and threats they pose to the company.Product design is the process of creating the features, functions, and specifications of the product or service that meet the customer needs and expectations. A HOQ chart aligns these two functions by comparing the company's product design with the competitors' product design, and showing how well the company's product design satisfies the customer requirements. This helps the company to identify the areas of improvement, differentiation, and innovation in the product design, and to create a competitive advantage in the market23. References: 1 House of Quality Tutorial - How to Fill Out a House of Quality | ASQ 4 2 House of quality | Explanation with example - IONOS 5 3 CPIM Exam References - Association for Supply Chain Management 1
NEW QUESTION # 90
A reduction In purchased lot sizes will reduce which of the following items?
- A. Frequency of orders
- B. Reorder points (ROPs)
- C. Setuptimes
- D. Inventory levels
Answer: D
Explanation:
A reduction in purchased lot sizes means ordering smaller quantities of materials more frequently. This reduces the average inventory level and the carrying cost of inventory. However, it also increases the frequency of orders and the ordering cost. The reorder point (ROP) is the level of inventory that triggers a new order, and it depends on the demand rate, the lead time, and the safety stock. The ROP is not affected by the lot size, unless the demand or the lead time changes. The setup time is the time required to prepare a machine or a process for production, and it is not related to the purchased lot size. References: EXAM CONTENT MANUAL PREVIEW, page 14, section 6.1.2. Manufacturing Planning and Control for Supply Chain Management: The CPIM Reference, Second Edition, page 433, section 12.4.
NEW QUESTION # 91
According to quality function deployment (QFD), customer needs are gathered through:
- A. surveys.
- B. technical specifications.
- C. employee suggestions.
- D. historical data.
Answer: A
Explanation:
According to quality function deployment (QFD), customer needs are gathered through surveys. QFD is a methodology for translating customer requirements into product or service specifications by listening to the voice of the customer (VOC). Surveys are one of the methods for collecting VOC data, which can include customer preferences, expectations, problems, and feedback. Surveys can be conducted through various channels, such as interviews, questionnaires, focus groups, or online platforms. Surveys help to identify and prioritize the customer needs and wants, and to measure the customer satisfaction and loyalty12. References: 1 What is Quality Function Deployment (QFD)? | ASQ 3 2 CPIM Exam References - Association for Supply Chain Management 1
NEW QUESTION # 92
Which of the following statements is true about the meantime between failures (MTBF) measure?
- A. It is used for non-repairable products.
- B. It is the same as operating life or service life.
- C. It is a useful measure of reliability.
- D. An increase in MTBF is proportional to anincrease inquality.
Answer: C
Explanation:
Mean time between failures (MTBF) is the average time that elapses from one unplanned breakdown to the next, under normal operating conditions. It is a useful measure of reliability because it indicates how long a repairable system typically operates before failing. Reliability is the absence of unplanned downtime, and MTBF measures how often a system stops performing as expected. The other statements are not true about MTBF. MTBF is not used for non-repairable products, as they cannot be fixed and put back into operation after a failure. For non-repairable products, mean time to failure (MTTF) is used as a measure of reliability.
MTBF is not proportional to quality, as quality is a broader concept that encompasses not only reliability, but also performance, durability, and customer satisfaction. MTBF is not the same as operating life or service life, as they referto the total time that a system can function before reaching the end of its useful life, while MTBF refers to the average time between failures within the operating life. References: Mean Time Between Failures (MTBF): How to Calculate & Increase, APICS CPIM 8 Planning and Inventory Management | ASCM
NEW QUESTION # 93
Given the information below, reducing which measure by 10% would contribute most to shortening the cash-to-cash cycle time?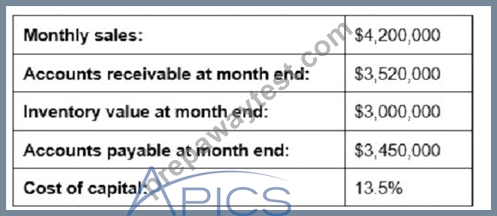
- A. Accounts payable
- B. Accounts receivable
- C. Inventory value
- D. Cost of capital
Answer: C
Explanation:
Reducing the inventory value by 10% would contribute most to shortening the cash-to-cash cycle time. The cash-to-cash cycle time is calculated as the days of inventory outstanding plus days of sales outstanding minus days of payables outstanding. By reducing the inventory value, the company can decrease the days of inventory outstanding, leading to a shorter cash-to-cash cycle time. This aligns with CPIM's focus on efficient inventory management to optimize the supply chain. References: The concepts are covered in detail in Module
4: Inventory Management
NEW QUESTION # 94
Typically, rough-cut capacity planning (RCCP) in a job shop environment would review which of the following work centers to determine the ability to execute the plan?
- A. Final assembly work centers only
- B. Gateway work centers only
- C. All work centers
- D. Critical work centers only
Answer: D
Explanation:
Rough-cut capacity planning (RCCP) is a technique that evaluates the feasibility of a master production schedule (MPS) by comparing the available capacity of key resources with the required capacity of the MPS.
In a job shop environment, where products are made to order and have high variety and low volume, RCCP would typically review only the critical work centers to determine the ability to execute the plan. Critical work centers are those that have the greatest impact on the throughput, lead time, or cost of the products. They are usually the work centers that have the highest utilization, longest setup times, or most frequent bottlenecks. By focusing on the critical work centers, RCCP can simplify the capacity planning process and identify the potential problems or constraints that may affect the MPS. The other options, gateway work centers, final assembly work centers, and all work centers, are not as effective as critical work centers for RCCP in a job shop environment, as they may not reflect the true capacity requirements or constraints of the products. References:
Rough Cut Capacity Planning (RCCP) - Definition, Example, and Benefits
Rough Cut Capacity Planning (RCCP) - Meaning, Objectives, and Advantages Rough Cut Capacity Planning (RCCP) - Overview, Steps, and Example
NEW QUESTION # 95
An example of a flexibility metric for an organization Is:
- A. cycle time.
- B. percentageof orders delivered late.
- C. average batch size.
- D. scrap rate.
Answer: A
Explanation:
A flexibility metric is a measure of how well an organization can adapt to changes in demand, supply, or technology. Flexibility metrics can be classified into three categories: volume flexibility, mix flexibility, and new product flexibility. Volume flexibility is the ability to adjust the output level to meet fluctuations in demand. Mix flexibility is the ability to produce different types of products or services with the same resources. New product flexibility is the ability to introduce new products or services quickly and efficiently.
Cycle time is an example of a flexibility metric, as it measures the time required to complete a process or activity, from start to finish. Cycle time can indicate the responsiveness and agility of an organization, as shorter cycle times imply faster delivery, lower inventory, and higher customer satisfaction. Cycle time can also reflect the efficiency and quality of an organization, as shorter cycle times imply less waste, fewer errors, and lower costs. Therefore, cycle time is a relevant metric for assessing the flexibility of an organization. References := CPIM Part 2 Exam Content Manual, Version 8.0, ASCM, 2021, p. 29. CPIM Part
2 Learning System, Version 8.0, Module 3, Section A, Topic 3.
NEW QUESTION # 96
Components of an organization's Immediate industry and competitive environment Include:
- A. sociocultural forces.
- B. substitute products.
- C. interest rates.
- D. political factors.
Answer: B
Explanation:
Substitute products are components of an organization's immediate industry and competitive environment.
They are products or services that can satisfy the same customer needs or wants as the organization's offerings, but are provided by different industries or markets. Substitute products can affect the demand, price, and profitability of the organization's products, and require the organization to monitor and respond to the changes in customer preferences and competitive pressures. Political factors, interest rates, and sociocultural forces are examples of macroenvironmental factors, which are broader and more general forces that affect the organization and its industry, but are not directly related to its competitors or customers. References := CPIM Exam Content Manual, Module 1: Supply Chains and Strategy, Section 1.1: Business Strategy, p.
4
Strategic Supply Chain Management: The Five Core Disciplines for Top Performance, Chapter 2: Align Your Supply Chain with Business Strategy, Section 2.2: Assessing the External Environment, pp. 25-26
NEW QUESTION # 97
An advantage of applying ABC classification to a firm's replenishment items is that:
- A. it allows planners to focus on critical products.
- B. it distinguishes independent demand from dependent demand.
- C. it provides better order quantities than the economic order quantity (EOQ).
- D. it allows the firm to utilize time-phased order point (TPOP).
Answer: A
Explanation:
ABC classification is a method of inventory management that categorizes items based on their annual consumption value, which is the product of the annual demand and the unit cost. Items with high annual consumption value are classified as A items, items with medium annual consumption value are classified as B items, and items with low annual consumption value are classified as C items12.
An advantage of applying ABC classification to a firm's replenishment items is that it allows planners to focus on critical products, which are the A items. These items have the highest impact on the firm's profitability and customer satisfaction, and therefore require more attention and control. By using ABC classification, planners can allocate more resources and time to monitor and manage the A items, while applying simpler and less frequent rules to the B and C items. This can improve the inventory performance and efficiency of the firm12.
The other options are not correct because:
*A. it distinguishes independent demand from dependent demand. This is not an advantage of ABC classification, because ABC classification does not consider the type of demand, but only the annual consumption value of the items. Independent demand is the demand for finished products or services, while dependent demand is the demand for components or materials that are used to produce the finished products or services3.
*C. it provides better order quantities than the economic order quantity (EOQ). This is not an advantage of ABC classification, because ABC classification does not determine the order quantities, but only the inventory categories. EOQ is a formula that calculates the optimal order quantity that minimizes the total inventory costs, such as ordering costs and holding costs.
*D. it allows the firm to utilize time-phased order point (TPOP). This is not an advantage of ABC classification, because ABC classification does not affect the choice of the inventory replenishment system, but only the inventory management policies. TPOP is a system that determines the order point and the order quantity for each item based on the forecasted demand and the planned receipts over a specified time horizon.
References := 1 ABC Inventory Analysis & Management | NetSuite1 2 What Is ABC Inventory Classification?
| Business.org2 3 Independent Demand vs Dependent Demand: What's the Difference? Economic Order Quantity (EOQ) - Overview, Formula, and Example Time-Phased Order Point (TPOP) - an overview | ScienceDirect Topics
NEW QUESTION # 98
Risk pooling would work best for items with:
- A. high demand uncertainty and short lead times.
- B. low demand uncertainty and short lead times.
- C. high demand uncertainty and long lead times.
- D. low demand uncertainty and long lead times.
Answer: C
Explanation:
Risk pooling is the concept of reducing the variability in demand for raw materials or finished goods by aggregating demand across multiple locations or products1. By doing so, the demand fluctuations are more likely to cancel out each other, resulting in a lower safety stock and inventory cost. Risk pooling works best for items with high demand uncertainty and long lead times, because these items have the highest risk of stockouts and the highest inventory holding cost. If the demand uncertainty is low, there is less need for risk pooling, as the demand can be easily forecasted and met. If the lead time is short, the replenishment orders can be placed more frequently and adjusted to the actual demand, reducing the need for safety stock and risk pooling2. References: 1 Inventory risk pooling definition - AccountingTools 3 2 Supply Chain Management:
Risk pooling - UNB 4
NEW QUESTION # 99
Which of the following statements is an assumption on which the economic order quantity (EOQ) model is based?
- A. Order preparation costs and inventory-carrying costs are constant and known.
- B. Items are purchased and/or produced continuously and not in batches.
- C. Holding costs, as a percentage of the unit cost, are variable.
- D. Customer demand is known but seasonal.
Answer: A
Explanation:
The economic order quantity (EOQ) model is a formula that calculates the optimal order quantity that minimizes the total inventory costs, such as ordering costs and holding costs. The EOQ model is based on several assumptions, one of which is that the order preparation costs and inventory-carrying costs are constant and known. This means that the costs of placing and receiving an order, and the costs of storing and maintaining the inventory, do not change with the order quantity or the inventory level, and that they can be estimated accurately12.
The other options are not correct because:
*A. Customer demand is known but seasonal. This is not an assumption of the EOQ model, but rather a violation of it. The EOQ model assumes that the customer demand is constant and known, and that the orders are placed at regular intervals. However, if the customer demand is seasonal, it means that it varies over time and may not be predictable. This can affect the accuracy and applicability of the EOQ model, as the optimal order quantity may change with the demand pattern12.
*B. Items are purchased and/or produced continuously and not in batches. This is not an assumption of the EOQ model, but rather a contradiction of it. The EOQ model assumes that the items are purchased and/or produced in batches, and that the inventory level decreases gradually until it reaches zero, at which point a new order is placed and received. However, if the items are purchased and/or produced continuously, it means that there is no need to place orders or maintain inventory, and the EOQ model becomes irrelevant12.
*D. Holding costs, as a percentage of the unit cost, are variable. This is not an assumption of the EOQ model, but rather a complication of it. The EOQ model assumes that the holding costs, as a percentage of the unit cost, are constant and known. This means that the cost of storing and maintaining one unit of inventory does not depend on the unit cost of the item, and that it can be estimated accurately. However, if the holding costs, as a percentage of the unit cost, are variable, it means that the cost of storing and maintaining one unit of inventory changes with the unit cost of the item, and that it may not be easy to estimate. This can affect the accuracy and applicability of the EOQ model, as the optimal order quantity may depend on the unit cost of the item12.
References := 1 Economic Order Quantity Model in Inventory Management - Investopedia1 2 Economic Order Quantity: What Does It Mean and Who Is It Important For? - Investopedia2
NEW QUESTION # 100
The time spent In queue by a specific manufacturing job is determined by which of the following factors related to the order?
- A. Setup time
- B. Lot size
- C. Run time
- D. Priority
Answer: D
Explanation:
The time spent in queue by a specific manufacturing job is determined by the priority of the order. Priority is the relative importance or urgency of an order compared to other orders in the system. Priority can be assigned based on various criteria, such as due date, customer preference, profitability, or first-come-first-served.
Priority determines the order in which jobs are processed at each workstation and affects the waiting time and flow time of each job. Higher priority jobs have shorter waiting times and lower priority jobs have longer waiting times. Priority can be used as a tool to manage the trade-offs between customer service, capacity utilization, and inventory levels. References:
Managing Supply Chain Operations, Chapter 7: Scheduling and Sequencing, Section 7.2: Priority Rules CPIM Exam Content Manual, Module 6: Detailed Schedules, Section 6.2: Scheduling and Sequencing, Subsection 6.2.2: Priority Rules
NEW QUESTION # 101
We have observed the inventory system does not handle plastic parts well." What should be added to the problem statement to make it more useful?
- A. Measurements that help describe the problem
- B. Description of who is responsible for the problem
- C. Guidance to which problem-solving tools should be used
- D. Criteria for selecting the improvement team
Answer: A
Explanation:
A problem statement is a concise description of an issue to be addressed or a condition to be improved upon. It identifies the gap between the current state and the desired state of a process or a system. A good problem statement should include measurements that help describe the problem, such as the magnitude, frequency, location, and impact of the problem. These measurements can help quantify the problem and provide a baseline for improvement. The other options are not essential for a problem statement, but rather for the subsequent steps of problem-solving, such as selecting tools, forming teams, and assigning responsibilities.
References:
*[CPIM Part 2 - Section B - Topic 1 - Quality and Continuous Improvement]
*How to Write a Problem Statement
NEW QUESTION # 102
Which of the following statements best characterizes enterprise resources planning (ERP) systems?
- A. They are expensive but easy to implement.
- B. They track activity from customer order through payment.
- C. They provide real-time planning and scheduling, decision support, available-to-promise (ATP), and capable-to-promise (CTP) capabilities.
- D. They are used for strategic reporting requirements.
Answer: C
Explanation:
Enterprise resource planning (ERP) systems are software platforms that help organizations manage and integrate the essential parts of their businesses, such as finance, supply chain, operations, human resources, and more. ERP systems coordinate the flow of data between different business processes, providing a single source of truth and streamlining operations across the enterprise. ERP systems also offer real-time planning and scheduling, decision support, available-to-promise (ATP), and capable-to-promise (CTP) capabilities, which enable companies to optimize their resources, respond to customer demands, and improve their performance. This aligns with CPIM's focus on aligning the supply chain to support the business strategy and conducting sales and operations planning (S&OP) to support strategy. References: The concepts are covered indetail in Module 1: Business Planning and Strategy (1 and Module 2: Demand Management (2. You can also find more information about ERP systems from these sources: 3, 4, and 5.
NEW QUESTION # 103
Which of the following outcomes Is a benefit of mixed-model scheduling?
- A. Increased inventory
- B. Fewer material shortages
- C. Fewer setups
- D. Improved demand response
Answer: C
Explanation:
Mixed-model scheduling is a technique that produces different models of the same product family in the same production line or work center. One of the benefits of mixed-model scheduling is that it reduces the number of setups required, as the models share common components and processes. Fewer setups can lead to lower setup costs, higher productivity, and better utilization of resources. The other outcomes are not benefits of mixed-model scheduling. Increased inventory, improved demand response, and fewer material shortages are more related to other factors such as inventory policies, demandforecasting, and supply planning. References: Mixed Model Scheduling | APICS Dictionary Term of the Day, APICS CPIM 8 Planning and Inventory Management | ASCM
NEW QUESTION # 104
When the discrete available-to-promise (ATP) method is used, the master production receipt quantity is committed to:
- A. any request for shipment prior to the planning time fence.
- B. requests only for shipment in the period of the receipt.
- C. any request for shipment prior to the demand time fence (DTF).
- D. requests only for shipment before the next master production schedule (MPS) receipt.
Answer: D
Explanation:
The discrete available-to-promise (ATP) method is a calculation based on the available-to-promise figure in the master schedule. For the first period, the ATP is the sum of the beginning inventory plus the MPS quantity minus backlog for all periods until the item is master scheduled again. For other periods, the quantity that is available for an item is based on the quantity available within an individual purchase. Therefore, the master production receipt quantity is committed to requests only for shipment before the next MPS receipt12.
References:
*1: APICS CPIM Part 2 Exam Content Manual, Version 8.0, p. 29
*2: NetSuite Applications Suite - Available to Promise Methods3
NEW QUESTION # 105
In a lean environment, the batch-size decision for planning "A" items would be done by:
- A. periodic order quantity.
- B. least total cost.
- C. min-max system.
- D. lot-for-lot (L4L).
Answer: D
Explanation:
In a lean environment, the batch-size decision for planning "A" items would be done by lot-for-lot (L4L). L4L is an inventory management technique that orders exactly the quantity needed to meet the demand for each period. This minimizes the work in process, cycle time, and inventory holding costs. L4L is consistent with the lean principles of reducing batch sizes, eliminating waste, and responding to customer pull. The other options are not suitable for a lean environment, as they either order more than the demand (least total cost, min-max system, periodic order quantity) or incur more setup costs (least total cost, periodic order quantity).
References:
*[CPIM Part 2 - Section A - Topic 3 - Lean and Just-in-Time]
*Optimize Production Batch Sizes
*How to determine your Lot Size - Part 1
NEW QUESTION # 106
If the total part failure rate of a machine is 0.00055 failures per hour, what would be the mean time between failures (MTBF) in hours?
- A. 1,818.2
- B. 0.99945
- C. 59.99945
- D. 1.98
Answer: A
Explanation:
The mean time between failures (MTBF) is the inverse of the failure rate. The failure rate is givenas 0.00055 failures per hour, so the MTBF is 1/0.00055 = 1,818.2 hours. This means that the average time the machine operates without failing is 1,818.2 hours. References: MTBF Formula | How to Calculate Mean Time Between Failure? - EDUCBA, Mean time between failures - Wikipedia
NEW QUESTION # 107
In preparing for a facility location decision, proximity to suppliers would be classified as which kind of criteria?
- A. Service level requirements
- B. Future flexibility factors
- C. Cost factors
- D. Access to transportation
Answer: C
Explanation:
Proximity to suppliers would be classified as a cost factor in preparing for a facility location decision. Cost factors are the expenses associated with operating a facility in a specific location, such as labor, materials, utilities, taxes, and transportation. Proximity to suppliers can affect the cost of inbound transportation, inventory holding, and quality control. Choosing a location that is close to suppliers can reduce these costs and improve the efficiency and reliability of the supply chain. References:
Managing Supply Chain Operations, Chapter 2: Global Supply Chain Strategy, Section 2.3: Facility Location CPIM Exam Content Manual, Module 1: Supply Chains and Strategy, Section 1.4: Facility Location, Subsection 1.4.1: Facility Location Concepts
NEW QUESTION # 108
Which of the following items does the master scheduler have the authority to change in the master scheduling process?
- A. Aggregate volume
- B. Customer order quantities
- C. Product mix
- D. Engineering change effectivity date
Answer: C
Explanation:
The master scheduler has the authority to change the product mix in the master scheduling process. The product mix is the combination and proportion of different products or product families that the company offers to its customers. The master scheduler can adjust the product mix based on the customer demand, the production capacity, the inventory levels, and the strategic objectives of the company. The master scheduler can also use the product mix to balance the demand and supply, to optimize the resource utilization, and to maximize the profitability. The other options are not correct, as they are items that the master scheduler does not have the authority to change in the master scheduling process, but rather inputs or constraints that the master scheduler has to follow or consider:
Aggregate volume is the total quantity of products or product families that the company plans to produce and deliver in a given period. Aggregate volume is determined by the sales and operations planning (S&OP) process, which involves the senior management and the functional managers of the company. The master scheduler has to align the master production schedule (MPS) with the aggregate volume, and cannot change it without the approval of the S&OP team.
Engineering change effectivity date is the date when a change in the design or specification of a product or a component becomes effective. Engineering change effectivity date is determined by the engineering department, which is responsible for the product development and innovation. The master scheduler has to incorporate the engineering change effectivity date into the MPS, and cannot change it without the approval of the engineering department.
Customer order quantities are the amounts of products or product families that the customers order from the company. Customer order quantities are determined by the market demand and the customer preferences. The master scheduler has to satisfy the customer order quantities as much as possible, and cannot change them without the approval of the customers or the sales and marketing department.
References:
[CPIM Part 2 - Section A - Topic 1 - Sales and Operations Planning]
Master Production Schedule (MPS)
Product Mix
Aggregate Planning
Engineering Change Management
Customer Order Management
NEW QUESTION # 109
One way to mitigate liability risk in the supply chain is to:
- A. push inventory to supplier locations.
- B. negotiate lower component cost.
- C. use less-than-truckload (LTL) shipments more frequently.
- D. require traceability for components.
Answer: D
Explanation:
One way to mitigate liability risk in the supply chain is to require traceability for components. Liability risk is the risk that a party may be held responsible for certain types of losses caused by its actions or products to third parties1. Traceability is the ability to track the origin, history, location, and movement of a product or a component through the supply chain2. Requiring traceability for components can help to mitigate liability risk in the supply chain by enabling the identification and verification of the quality, safety, and compliance of the components, as well as the detection and prevention of counterfeit, defective, or hazardous components.
Traceability can also facilitate the recall, repair, or replacement of faulty components, and the allocation of responsibility and accountability among the supply chain partners in case of a liability claim34. References: 1 What is a Liability Risk? - Definition from Insuranceopedia 5 2 Traceability - Wikipedia 6 3 Supply Chain Liability in the Corporate Sustainability Due Diligence ... 7 4 CPIM Exam References - Association for Supply Chain Management 8
NEW QUESTION # 110
......
Updated Verified CPIM-8.0 dumps Q&As - Pass Guarantee or Full Refund: https://www.prepawaytest.com/APICS/CPIM-8.0-practice-exam-dumps.html
CPIM-8.0 PDF Questions and Testing Engine With 152 Questions: https://drive.google.com/open?id=1mPfNoTMcnN796DL4afjCAxVSqScpjj19