

2024 Latest 100% Exam Passing Ratio - Databricks-Certified-Data-Analyst-Associate Dumps PDF
Pass Exam With Full Sureness - Databricks-Certified-Data-Analyst-Associate Dumps with 47 Questions
Databricks Databricks-Certified-Data-Analyst-Associate Exam Syllabus Topics:
| Topic | Details |
|---|---|
| Topic 1 |
|
| Topic 2 |
|
| Topic 3 |
|
| Topic 4 |
|
| Topic 5 |
|
NEW QUESTION # 16
Which of the following is a benefit of Databricks SQL using ANSI SQL as its standard SQL dialect?
- A. It is easy to migrate existing SQL queries to Databricks SQL
- B. It allows for the use of Photon's computation optimizations
- C. It is more compatible with Spark's interpreters
- D. It is more performant than other SQL dialects
- E. It has increased customization capabilities
Answer: A
Explanation:
Databricks SQL uses ANSI SQL as its standard SQL dialect, which means it follows the SQL specifications defined by the American National Standards Institute (ANSI). This makes it easier to migrate existing SQL queries from other data warehouses or platforms that also use ANSI SQL or a similar dialect, such as PostgreSQL, Oracle, or Teradata. By using ANSI SQL, Databricks SQL avoids surprises in behavior or unfamiliar syntax that may arise from using a non-standard SQL dialect, such as Spark SQL or Hive SQL12. Moreover, Databricks SQL also adds compatibility features to support common SQL constructs that are widely used in other data warehouses, such as QUALIFY, FILTER, and user-defined functions2. Reference: ANSI compliance in Databricks Runtime, Evolution of the SQL language at Databricks: ANSI standard by default and easier migrations from data warehouses
NEW QUESTION # 17
Data professionals with varying titles use the Databricks SQL service as the primary touchpoint with the Databricks Lakehouse Platform. However, some users will use other services like Databricks Machine Learning or Databricks Data Science and Engineering.
Which of the following roles uses Databricks SQL as a secondary service while primarily using one of the other services?
- A. SQL analyst
- B. Data engineer
- C. Business analyst
- D. Business intelligence analyst
- E. Data analyst
Answer: B
Explanation:
Data engineers are primarily responsible for building, managing, and optimizing data pipelines and architectures. They use Databricks Data Science and Engineering service to perform tasks such as data ingestion, transformation, quality, and governance. Data engineers may use Databricks SQL as a secondary service to query, analyze, and visualize data from the lakehouse, but this is not their main focus. Reference: Databricks SQL overview, Databricks Data Science and Engineering overview, Data engineering with Databricks
NEW QUESTION # 18
A data analyst has a managed table table_name in database database_name. They would now like to remove the table from the database and all of the data files associated with the table. The rest of the tables in the database must continue to exist.
Which of the following commands can the analyst use to complete the task without producing an error?
- A. DELETE TABLE database_name.table_name;
- B. DROP TABLE database_name.table_name;
- C. DELETE TABLE table_name FROM database_name;
- D. DROP TABLE table_name FROM database_name;
- E. DROP DATABASE database_name;
Answer: B
NEW QUESTION # 19
In which of the following situations will the mean value and median value of variable be meaningfully different?
- A. When the variable contains no outliers
- B. When the variable contains no missing values
- C. When the variable is of the boolean type
- D. When the variable is of the categorical type
- E. When the variable contains a lot of extreme outliers
Answer: E
Explanation:
The mean value of a variable is the average of all the values in a data set, calculated by dividing the sum of the values by the number of values. The median value of a variable is the middle value of the ordered data set, or the average of the middle two values if the data set has an even number of values. The mean value is sensitive to outliers, which are values that are very different from the rest of the data. Outliers can skew the mean value and make it less representative of the central tendency of the data. The median value is more robust to outliers, as it only depends on the middle values of the data. Therefore, when the variable contains a lot of extreme outliers, the mean value and the median value will be meaningfully different, as the mean value will be pulled towards the outliers, while the median value will remain close to the majority of the data1. Reference: Difference Between Mean and Median in Statistics (With Example) - BYJU'S
NEW QUESTION # 20
In which of the following situations should a data analyst use higher-order functions?
- A. When custom logic needs to be applied at scale to array data objects
- B. When custom logic needs to be applied to simple, unnested data
- C. When built-in functions need to run through the Catalyst Optimizer
- D. When custom logic needs to be converted to Python-native code
- E. When built-in functions are taking too long to perform tasks
Answer: A
Explanation:
Higher-order functions are a simple extension to SQL to manipulate nested data such as arrays. A higher-order function takes an array, implements how the array is processed, and what the result of the computation will be. It delegates to a lambda function how to process each item in the array. This allows you to define functions that manipulate arrays in SQL, without having to unpack and repack them, use UDFs, or rely on limited built-in functions. Higher-order functions provide a performance benefit over user defined functions. Reference: Higher-order functions | Databricks on AWS, Working with Nested Data Using Higher Order Functions in SQL on Databricks | Databricks Blog, Higher-order functions - Azure Databricks | Microsoft Learn, Optimization recommendations on Databricks | Databricks on AWS
NEW QUESTION # 21
A data analyst is working with gold-layer tables to complete an ad-hoc project. A stakeholder has provided the analyst with an additional dataset that can be used to augment the gold-layer tables already in use.
Which of the following terms is used to describe this data augmentation?
- A. Ad-hoc improvements
- B. Data testing
- C. Last-mile ETL
- D. Last-mile
- E. Data enhancement
Answer: E
Explanation:
Data enhancement is the process of adding or enriching data with additional information to improve its quality, accuracy, and usefulness. Data enhancement can be used to augment existing data sources with new data sources, such as external datasets, synthetic data, or machine learning models. Data enhancement can help data analysts to gain deeper insights, discover new patterns, and solve complex problems. Data enhancement is one of the applications of generative AI, which can leverage machine learning to generate synthetic data for better models or safer data sharing1.
In the context of the question, the data analyst is working with gold-layer tables, which are curated business-level tables that are typically organized in consumption-ready project-specific databases234. The gold-layer tables are the final layer of data transformations and data quality rules in the medallion lakehouse architecture, which is a data design pattern used to logically organize data in a lakehouse2. The stakeholder has provided the analyst with an additional dataset that can be used to augment the gold-layer tables already in use. This means that the analyst can use the additional dataset to enhance the existing gold-layer tables with more information, such as new features, attributes, or metrics. This data augmentation can help the analyst to complete the ad-hoc project more effectively and efficiently.
Reference:
What is the medallion lakehouse architecture? - Databricks
Data Warehousing Modeling Techniques and Their Implementation on the Databricks Lakehouse Platform | Databricks Blog What is the medallion lakehouse architecture? - Azure Databricks What is a Medallion Architecture? - Databricks Synthetic Data for Better Machine Learning | Databricks Blog
NEW QUESTION # 22
A data analysis team is working with the table_bronze SQL table as a source for one of its most complex projects. A stakeholder of the project notices that some of the downstream data is duplicative. The analysis team identifies table_bronze as the source of the duplication.
Which of the following queries can be used to deduplicate the data from table_bronze and write it to a new table table_silver?
A)
CREATE TABLE table_silver AS
SELECT DISTINCT *
FROM table_bronze;
B)
CREATE TABLE table_silver AS
INSERT *
FROM table_bronze;
C)
CREATE TABLE table_silver AS
MERGE DEDUPLICATE *
FROM table_bronze;
D)
INSERT INTO TABLE table_silver
SELECT * FROM table_bronze;
E)
INSERT OVERWRITE TABLE table_silver
SELECT * FROM table_bronze;
- A. Option B
- B. Option C
- C. Option D
- D. Option A
- E. Option E
Answer: D
Explanation:
Option A uses the SELECT DISTINCT statement to remove duplicate rows from the table_bronze and create a new table table_silver with the deduplicated data. This is the correct way to deduplicate data using Spark SQL12. Option B simply inserts all the rows from table_bronze into table_silver, without removing any duplicates. Option C is not a valid syntax for Spark SQL, as there is no MERGE DEDUPLICATE statement. Option D appends all the rows from table_bronze into table_silver, without removing any duplicates. Option E overwrites the existing data in table_silver with the data from table_bronze, without removing any duplicates. Reference: Delete Duplicate using SPARK SQL, Spark SQL - How to Remove Duplicate Rows
NEW QUESTION # 23
A data analyst has been asked to provide a list of options on how to share a dashboard with a client. It is a security requirement that the client does not gain access to any other information, resources, or artifacts in the database.
Which of the following approaches cannot be used to share the dashboard and meet the security requirement?
- A. Download a PNG file of the visualizations in the dashboard and share them with the client.
- B. Generate a Personal Access Token that is good for 1 day and share it with the client.
- C. Set a refresh schedule for the dashboard and enter the client's email address in the "Subscribers" box.
- D. Download the Dashboard as a PDF and share it with the client.
- E. Take a screenshot of the dashboard and share it with the client.
Answer: B
Explanation:
The approach that cannot be used to share the dashboard and meet the security requirement is D. Generating a Personal Access Token that is good for 1 day and sharing it with the client. This approach would give the client access to the Databricks workspace using the token owner's identity and permissions, which could expose other information, resources, or artifacts in the database1. The other approaches can be used to share the dashboard and meet the security requirement because:
A) Downloading the Dashboard as a PDF and sharing it with the client would only provide a static snapshot of the dashboard without any interactive features or access to the underlying data2.
B) Setting a refresh schedule for the dashboard and entering the client's email address in the "Subscribers" box would send the client an email with the latest dashboard results as an attachment or a link to a secure web page3. The client would not be able to access the Databricks workspace or the dashboard itself.
C) Taking a screenshot of the dashboard and sharing it with the client would also only provide a static snapshot of the dashboard without any interactive features or access to the underlying data4.
E) Downloading a PNG file of the visualizations in the dashboard and sharing them with the client would also only provide a static snapshot of the visualizations without any interactive features or access to the underlying data5. Reference:
1: Personal access tokens
2: Download as PDF
3: Automatically refresh a dashboard
4: Take a screenshot
5: Download a PNG file
NEW QUESTION # 24
A data organization has a team of engineers developing data pipelines following the medallion architecture using Delta Live Tables. While the data analysis team working on a project is using gold-layer tables from these pipelines, they need to perform some additional processing of these tables prior to performing their analysis.
Which of the following terms is used to describe this type of work?
- A. Last-mile ETL
- B. Data enhancement
- C. Data blending
- D. Data testing
- E. Last-mile
Answer: A
Explanation:
Last-mile ETL is the term used to describe the additional processing of data that is done by data analysts or data scientists after the data has been ingested, transformed, and stored in the lakehouse by data engineers. Last-mile ETL typically involves tasks such as data cleansing, data enrichment, data aggregation, data filtering, or data sampling that are specific to the analysis or machine learning use case. Last-mile ETL can be done using Databricks SQL, Databricks notebooks, or Databricks Machine Learning. Reference: Databricks - Last-mile ETL, Databricks - Data Analysis with Databricks SQL
NEW QUESTION # 25
Consider the following two statements:
Statement 1:
Statement 2:
Which of the following describes how the result sets will differ for each statement when they are run in Databricks SQL?
- A. Both statements will fail because Databricks SQL does not support those join types.
- B. There is no difference between the result sets for both statements.
- C. The first statement will return all data from the customers table and matching data from the orders table. The second statement will return all data from the orders table and matching data from the customers table. Any missing data will be filled in with NULL.
- D. When the first statement is run, only rows from the customers table that have at least one match with the orders table on customer_id will be returned. When the second statement is run, only those rows in the customers table that do not have at least one match with the orders table on customer_id will be returned.
- E. When the first statement is run, all rows from the customers table will be returned and only the customer_id from the orders table will be returned. When the second statement is run, only those rows in the customers table that do not have at least one match with the orders table on customer_id will be returned.
Answer: D
Explanation:
Based on the images you sent, the two statements are SQL queries for different types of joins between the customers and orders tables. A join is a way of combining the rows from two table references based on some criteria. The join type determines how the rows are matched and what kind of result set is returned. The first statement is a query for a LEFT SEMI JOIN, which returns only the rows from the left table reference (customers) that have a match with the right table reference (orders) on the join condition (customer_id). The second statement is a query for a LEFT ANTI JOIN, which returns only the rows from the left table reference (customers) that have no match with the right table reference (orders) on the join condition (customer_id). Therefore, the result sets for the two statements will differ in the following way:
The first statement will return a subset of the customers table that contains only the customers who have placed at least one order. The number of rows returned will be less than or equal to the number of rows in the customers table, depending on how many customers have orders. The number of columns returned will be the same as the number of columns in the customers table, as the LEFT SEMI JOIN does not include any columns from the orders table.
The second statement will return a subset of the customers table that contains only the customers who have not placed any order. The number of rows returned will be less than or equal to the number of rows in the customers table, depending on how many customers have no orders. The number of columns returned will be the same as the number of columns in the customers table, as the LEFT ANTI JOIN does not include any columns from the orders table.
The other options are not correct because:
A) The first statement will not return all data from the customers table, as it will exclude the customers who have no orders. The second statement will not return all data from the orders table, as it will exclude the orders that have a matching customer. Neither statement will fill in any missing data with NULL, as they do not return any columns from the other table.
C) There is a difference between the result sets for both statements, as explained above. The LEFT SEMI JOIN and the LEFT ANTI JOIN are not equivalent operations and will produce different outputs.
D) Both statements will not fail, as Databricks SQL does support those join types. Databricks SQL supports various join types, including INNER, LEFT OUTER, RIGHT OUTER, FULL OUTER, LEFT SEMI, LEFT ANTI, and CROSS. You can also use NATURAL, USING, or LATERAL keywords to specify different join criteria.
E) The first statement will not return only the customer_id from the orders table, as it will return all columns from the customers table. The second statement is correct, but it is not the only difference between the result sets.
NEW QUESTION # 26
A data analyst needs to use the Databricks Lakehouse Platform to quickly create SQL queries and data visualizations. It is a requirement that the compute resources in the platform can be made serverless, and it is expected that data visualizations can be placed within a dashboard.
Which of the following Databricks Lakehouse Platform services/capabilities meets all of these requirements?
- A. Databricks Machine Learning
- B. Databricks Notebooks
- C. Tableau
- D. Databricks SQL
- E. Delta Lake
Answer: D
Explanation:
Databricks SQL is a serverless data warehouse on the Lakehouse that lets you run all of your SQL and BI applications at scale with your tools of choice, all at a fraction of the cost of traditional cloud data warehouses1. Databricks SQL allows you to create SQL queries and data visualizations using the SQL Analytics UI or the Databricks SQL CLI2. You can also place your data visualizations within a dashboard and share it with other users in your organization3. Databricks SQL is powered by Delta Lake, which provides reliability, performance, and governance for your data lake4. Reference:
Databricks SQL
Query data using SQL Analytics
Visualizations in Databricks notebooks
Delta Lake
NEW QUESTION # 27
A data analyst has recently joined a new team that uses Databricks SQL, but the analyst has never used Databricks before. The analyst wants to know where in Databricks SQL they can write and execute SQL queries.
On which of the following pages can the analyst write and execute SQL queries?
- A. Alerts page
- B. Dashboards page
- C. SQL Editor page
- D. Queries page
- E. Data page
Answer: C
Explanation:
The SQL Editor page is where the analyst can write and execute SQL queries in Databricks SQL. The SQL Editor page has a query pane where the analyst can type or paste SQL statements, and a results pane where the analyst can view the query results in a table or a chart. The analyst can also browse data objects, edit multiple queries, execute a single query or multiple queries, terminate a query, save a query, download a query result, and more from the SQL Editor page. Reference: Create a query in SQL editor
NEW QUESTION # 28
Which of the following statements about adding visual appeal to visualizations in the Visualization Editor is incorrect?
- A. Visualization scale can be changed.
- B. Borders can be added.
- C. Tooltips can be formatted.
- D. Data Labels can be formatted.
- E. Colors can be changed.
Answer: B
Explanation:
The Visualization Editor in Databricks SQL allows users to create and customize various types of charts and visualizations from the query results. Users can change the visualization type, select the data fields, adjust the colors, format the data labels, and modify the tooltips. However, there is no option to add borders to the visualizations in the Visualization Editor. Borders are not a supported feature of the new chart visualizations in Databricks1. Therefore, the statement that borders can be added is incorrect. Reference:
New chart visualizations in Databricks | Databricks on AWS
NEW QUESTION # 29
An analyst writes a query that contains a query parameter. They then add an area chart visualization to the query. While adding the area chart visualization to a dashboard, the analyst chooses "Dashboard Parameter" for the query parameter associated with the area chart.
Which of the following statements is true?
- A. The area chart will use whatever value is input by the analyst when the visualization is added to the dashboard. The parameter cannot be changed by the user afterwards.
- B. The area chart will use whatever is selected in the Dashboard Parameter along with all of the other visualizations in the dashboard that use the same parameter.
- C. The area chart will use whatever is selected in the Dashboard Parameter while all or the other visualizations will remain changed regardless of their parameter use.
- D. The area chart will use whatever value is chosen on the dashboard at the time the area chart is added to the dashboard.
- E. The area chart will convert to a Dashboard Parameter.
Answer: B
Explanation:
A Dashboard Parameter is a parameter that is configured for one or more visualizations within a dashboard and appears at the top of the dashboard. The parameter values specified for a Dashboard Parameter apply to all visualizations reusing that particular Dashboard Parameter1. Therefore, if the analyst chooses "Dashboard Parameter" for the query parameter associated with the area chart, the area chart will use whatever is selected in the Dashboard Parameter along with all of the other visualizations in the dashboard that use the same parameter. This allows the user to filter the data across multiple visualizations using a single parameter widget2. Reference: Databricks SQL dashboards, Query parameters
NEW QUESTION # 30
Which of the following is an advantage of using a Delta Lake-based data lakehouse over common data lake solutions?
- A. Scalable storage
- B. Flexible schemas
- C. Open-source formats
- D. ACID transactions
- E. Data deletion
Answer: D
Explanation:
A Delta Lake-based data lakehouse is a data platform architecture that combines the scalability and flexibility of a data lake with the reliability and performance of a data warehouse. One of the key advantages of using a Delta Lake-based data lakehouse over common data lake solutions is that it supports ACID transactions, which ensure data integrity and consistency. ACID transactions enable concurrent reads and writes, schema enforcement and evolution, data versioning and rollback, and data quality checks. These features are not available in traditional data lakes, which rely on file-based storage systems that do not support transactions. Reference:
Delta Lake: Lakehouse, warehouse, advantages | Definition
Synapse - Data Lake vs. Delta Lake vs. Data Lakehouse
Data Lake vs. Delta Lake - A Detailed Comparison
Building a Data Lakehouse with Delta Lake Architecture: A Comprehensive Guide
NEW QUESTION # 31
Which of the following should data analysts consider when working with personally identifiable information (PII) data?
- A. Legal requirements for the area in which the analysis is being performed
- B. Organization-specific best practices for Pll data
- C. Legal requirements for the area in which the data was collected
- D. All of these considerations
- E. None of these considerations
Answer: D
Explanation:
Data analysts should consider all of these factors when working with PII data, as they may affect the data security, privacy, compliance, and quality. PII data is any information that can be used to identify a specific individual, such as name, address, phone number, email, social security number, etc. PII data may be subject to different legal and ethical obligations depending on the context and location of the data collection and analysis. For example, some countries or regions may have stricter data protection laws than others, such as the General Data Protection Regulation (GDPR) in the European Union. Data analysts should also follow the organization-specific best practices for PII data, such as encryption, anonymization, masking, access control, auditing, etc. These best practices can help prevent data breaches, unauthorized access, misuse, or loss of PII data. Reference:
How to Use Databricks to Encrypt and Protect PII Data
Automating Sensitive Data (PII/PHI) Detection
Databricks Certified Data Analyst Associate
NEW QUESTION # 32
Which of the following describes how Databricks SQL should be used in relation to other business intelligence (BI) tools like Tableau, Power BI, and looker?
- A. As a complete replacement with additional functionality
- B. As a substitute with less functionality
- C. As a complementary tool for professional-grade presentations
- D. As an exact substitute with the same level of functionality
- E. As a complementary tool for quick in-platform Bl work
Answer: E
Explanation:
Databricks SQL is not meant to replace or substitute other BI tools, but rather to complement them by providing a fast and easy way to query, explore, and visualize data on the lakehouse using the built-in SQL editor, visualizations, and dashboards. Databricks SQL also integrates seamlessly with popular BI tools like Tableau, Power BI, and Looker, allowing analysts to use their preferred tools to access data through Databricks clusters and SQL warehouses. Databricks SQL offers low-code and no-code experiences, as well as optimized connectors and serverless compute, to enhance the productivity and performance of BI workloads on the lakehouse. Reference: Databricks SQL, Connecting Applications and BI Tools to Databricks SQL, Databricks integrations overview, Databricks SQL: Delivering a Production SQL Development Experience on the Lakehouse
NEW QUESTION # 33
Which of the following statements describes descriptive statistics?
- A. A branch of statistics that uses quantitative variables that must take on a finite or countably infinite set of values.
- B. A branch of statistics that uses summary statistics to categorically describe and summarize data.
- C. A branch of statistics that uses summary statistics to quantitatively describe and summarize data.
- D. A branch of statistics that uses quantitative variables that must take on an uncountable set of values.
- E. A branch of statistics that uses a variety of data analysis techniques to infer properties of an underlying distribution of probability.
Answer: C
Explanation:
Descriptive statistics is a branch of statistics that uses summary statistics, such as mean, median, mode, standard deviation, range, frequency, or correlation, to quantitatively describe and summarize data. Descriptive statistics can help data analysts understand the main features of a data set, such as its central tendency, variability, or distribution. Descriptive statistics can also help data analysts visualize data using charts, graphs, or tables. Descriptive statistics do not make any inferences or predictions about the data, unlike inferential statistics, which use data analysis techniques to infer properties of an underlying population or probability distribution from a sample of data. Reference: Databricks - Descriptive Statistics, Databricks - Data Analysis with Databricks SQL
NEW QUESTION # 34
A data analyst runs the following command:
SELECT age, country
FROM my_table
WHERE age >= 75 AND country = 'canada';
Which of the following tables represents the output of the above command?
- A.
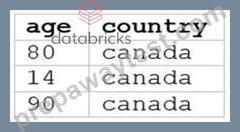
- B.

- C.

- D.
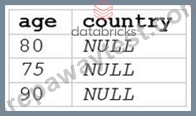
- E.
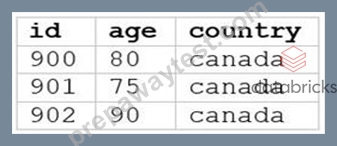
Answer: C
Explanation:
The SQL query provided is designed to filter out records from "my_table" where the age is 75 or above and the country is Canada. Since I can't view the content of the links provided directly, I need to rely on the image attached to this question for context. Based on that, Option E (the image attached) represents a table with columns "age" and "country", showing records where age is 75 or above and country is Canada. Reference: The answer can be inferred from understanding SQL queries and their outputs as per Databricks documentation: Databricks SQL
NEW QUESTION # 35
......
Verified Databricks-Certified-Data-Analyst-Associate dumps Q&As - 100% Pass from PrepAwayTest: https://www.prepawaytest.com/Databricks/Databricks-Certified-Data-Analyst-Associate-practice-exam-dumps.html
Pass Databricks-Certified-Data-Analyst-Associate Exam in First Attempt Guaranteed 2024 Dumps: https://drive.google.com/open?id=1ZUtNlCZhx2pORiy8XKItKsyqoMBNje2F